

For many Paid Media executives, Excel has long been the default reporting tool. Yet manual exports, copy-and-paste workflows and version control issues waste valuable time. If you are still downloading data from platforms like Google Ads and Meta Ads Manager into spreadsheets each week, you are reporting below your potential.
Modern executive reporting should be automated, accurate and available in real time. This is where Looker Studio becomes crucial.
Why Paid Media Executives Must Move Beyond Excel
Excel is powerful, but it was not built for live cross-channel marketing data. Paid Media performance changes daily. Static spreadsheets cannot reflect real-time budget pacing, blended ROAS or acquisition efficiency.
Manual reporting creates three key risks:
- Human error during exports and formula updates
- Inconsistent metric definitions across channels
- Delayed insights that slow decision-making
Automating reporting allows you to focus on optimisation, forecasting and strategic growth rather than formatting tables.
Eliminating Manual Exports From Ad Platforms
The first step in automating Paid Media reporting is removing the need to download CSV files.
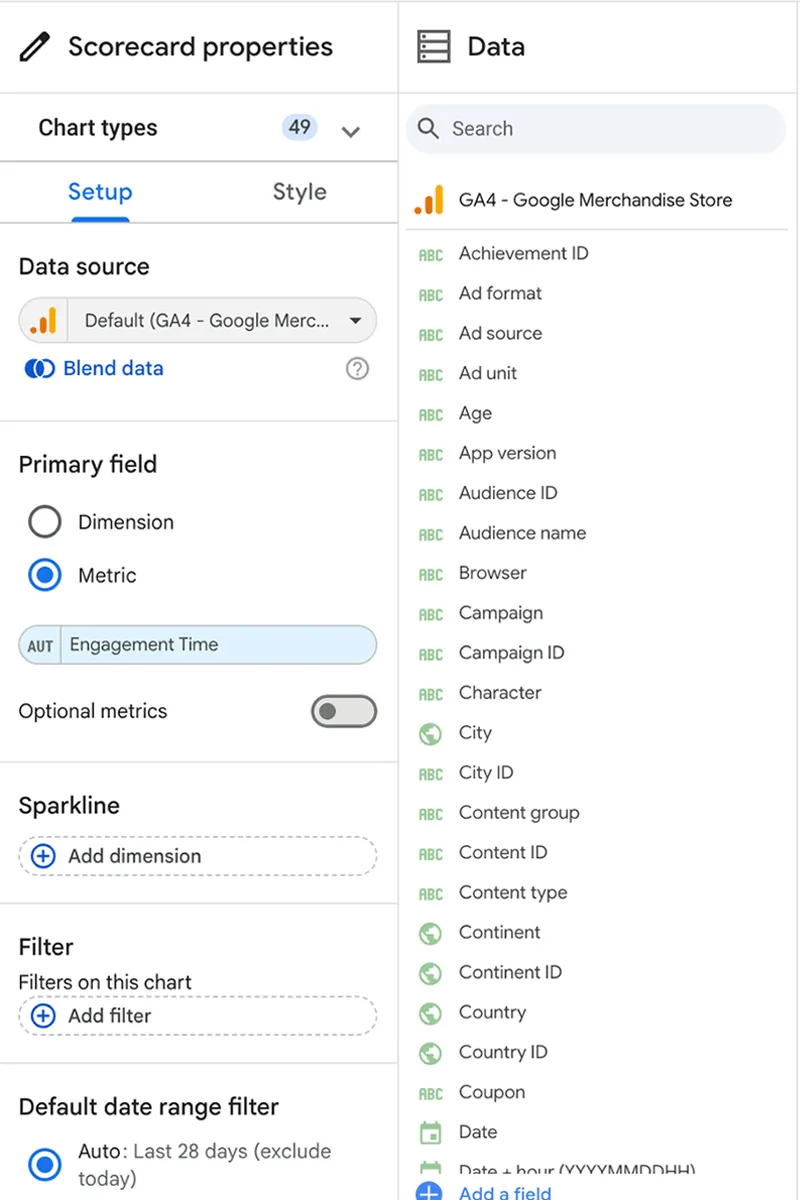
Connect Data Sources Directly
Looker Studio allows direct integration with:
- Google Ads
- Google Analytics 4
- YouTube
- Google Sheets
For official documentation on supported connectors see here.
Third-party connectors can also pull in Meta, LinkedIn and other platforms, eliminating repetitive data extraction.
Standardise Naming Conventions
Before building dashboards, ensure campaign naming conventions are consistent across platforms. This allows you to:
- Blend data accurately
- Create channel-level reporting
- Avoid duplicated campaign groupings
Consistency at account level reduces reporting confusion.
Auto-Refresh Best Practices for Accurate Reporting
Automation only works if your data remains up to date.
Understand Data Freshness
Each data source refreshes at different intervals. For example:
- Google Ads typically refreshes several times daily
- GA4 refresh timing depends on your property settings
You can review freshness details within each data connector inside Looker Studio.
Configure Automatic Data Updates
To maintain accuracy:
- Use native connectors where possible
- Avoid manual Google Sheet uploads
- Ensure API connectors are set to daily or intra-day refresh
- Regularly audit data discrepancies
A dashboard should reflect yesterday’s performance without anyone touching it.
Designing A Quality Automated Dashboard
Automation is not only about pulling data; it is about presenting it clearly.
Focus on relevant decision driving KPIs
Examples to prioritise include:
- Total Spend
- Total Revenue
- ROAS
- Cost per Acquisition (CPA)
- Conversion Rate
Avoid overwhelming those who your report goes to with too many metrics, keep them relevant.
Structure With Clarity
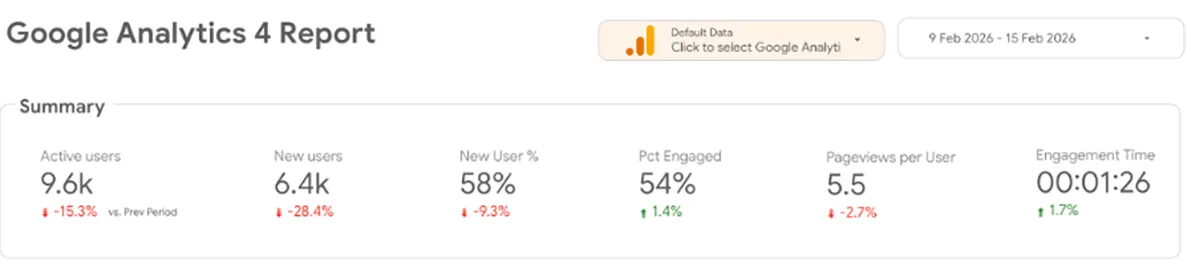
Section 1: Performance Overview
Use large scorecards displaying key metrics to give a quick overview of how the client is performing. Examples include:
- Month-to-date spend
- Revenue
- ROAS
- Conversion
- Conversion Rate
- CPA
Section 2: Table Comparison
Include a clean table with multiple metrics in the columns to be able to look at how metrics are performing all together or split it out to multiple tables for one metric each. Example tables include:
- Primary Channel
- Spend
- Revenue
- ROAS
- CPA
Section 3: Trends and Forecasts
It’s important to look at the same data metrics over different periods of time. This helps you look for trends and can also help you put together forecasts for future campaigns. Types of trends to be looking at include:
- Spend over time
- Revenue over time
- Conversions over time
- Conversion rate over time
- ROAS trend
This allows everyone to understand direction, not just the current position of the metrics.
Include Context
It’s very important to have all of these metrics in your reporting clear and accurate, but the numbers need more context. You need to write the narrative of your report to get across to your client what is happening with their metrics, why they are trending up and what you’re going to improve if they’re trending downwards.
Looker Studio allows you to add text boxes to explain everything that your client is seeing in the report. It also helps you be able to educate the client on things like seasonal shifts and anomalies in the data.
Final Thoughts
Executive reporting without Excel is not about abandoning spreadsheets entirely. It is about removing repetitive tasks and building a reliable, automated system that delivers clarity.
By eliminating manual exports, implementing proper auto-refresh practices and scheduling structured delivery, you create a reporting engine that works continuously in the background.
The result is simple: less admin, more insight and stronger outcomes. If you are leading paid media strategy in 2026 and beyond, automation in Looker Studio is not optional. It is essential.
If you’d like to hear more about the Paid Media work that Twilo offers or any of our other Digital Marketing services, get in touch and we’d love to speak to you about how we can grow your business.